STEPS
TOOLS

Here are the supplies you need
1st Take your compass (a mathematical instrument used for drawing perfect circles) and draw a fairly large circle as shown.
Then you need to find the center point of the circle and mark it with a dot.
Now for the tricky bit.
To figure out what angle you have to use for each portion of the graph use the formula shown below. first put a decimal in front of the percentage (0.25) Then multiply it by 360 (0.25x360)
Then find the angle on your...
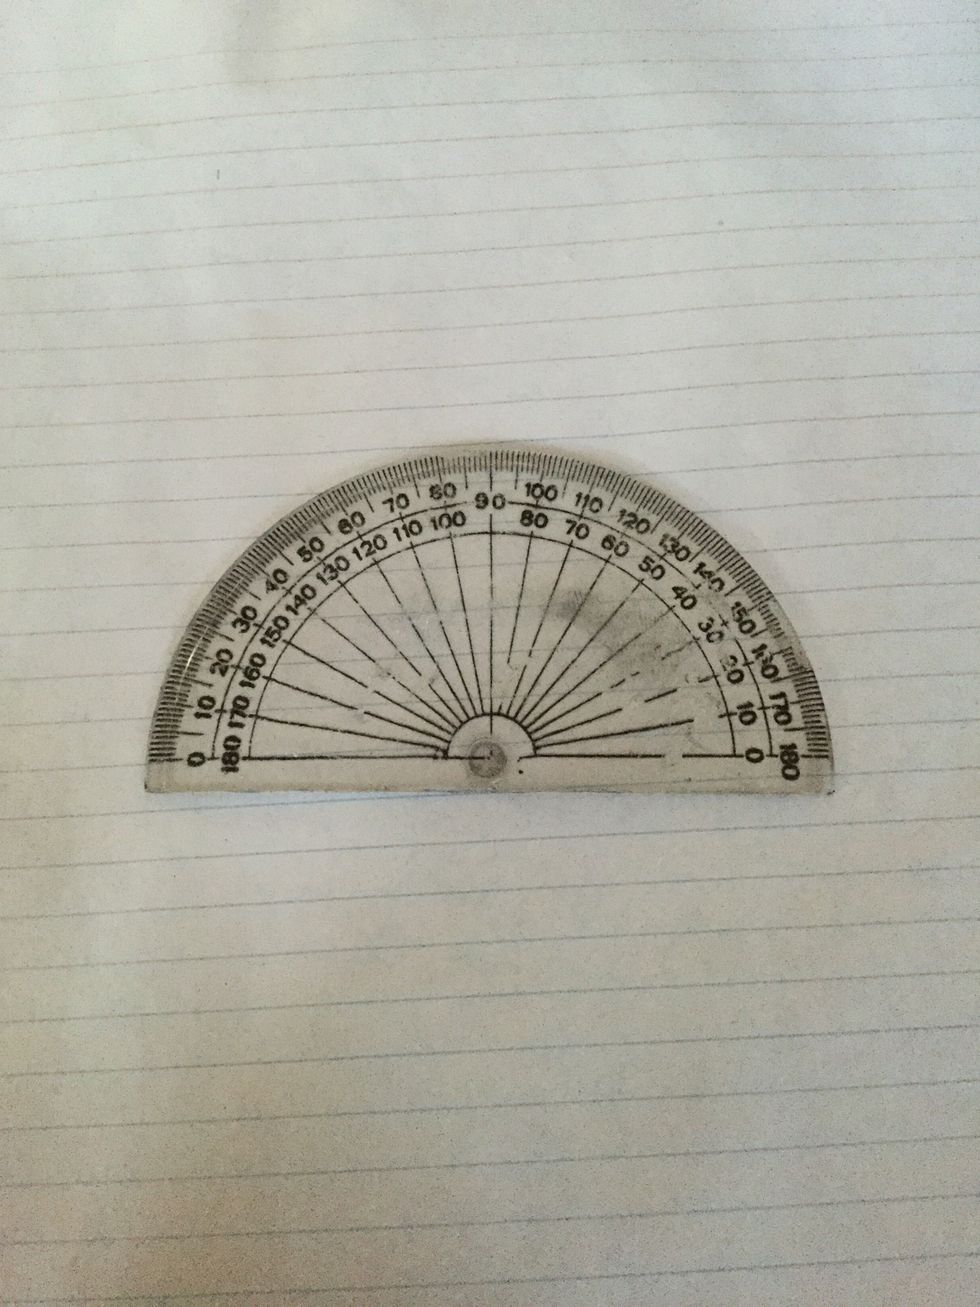
Protractor a mathematical tool for finding and drawing angles
Let's say that the angle I came up with was 50. I would use the protractor to find that angle.
Here's how it's done
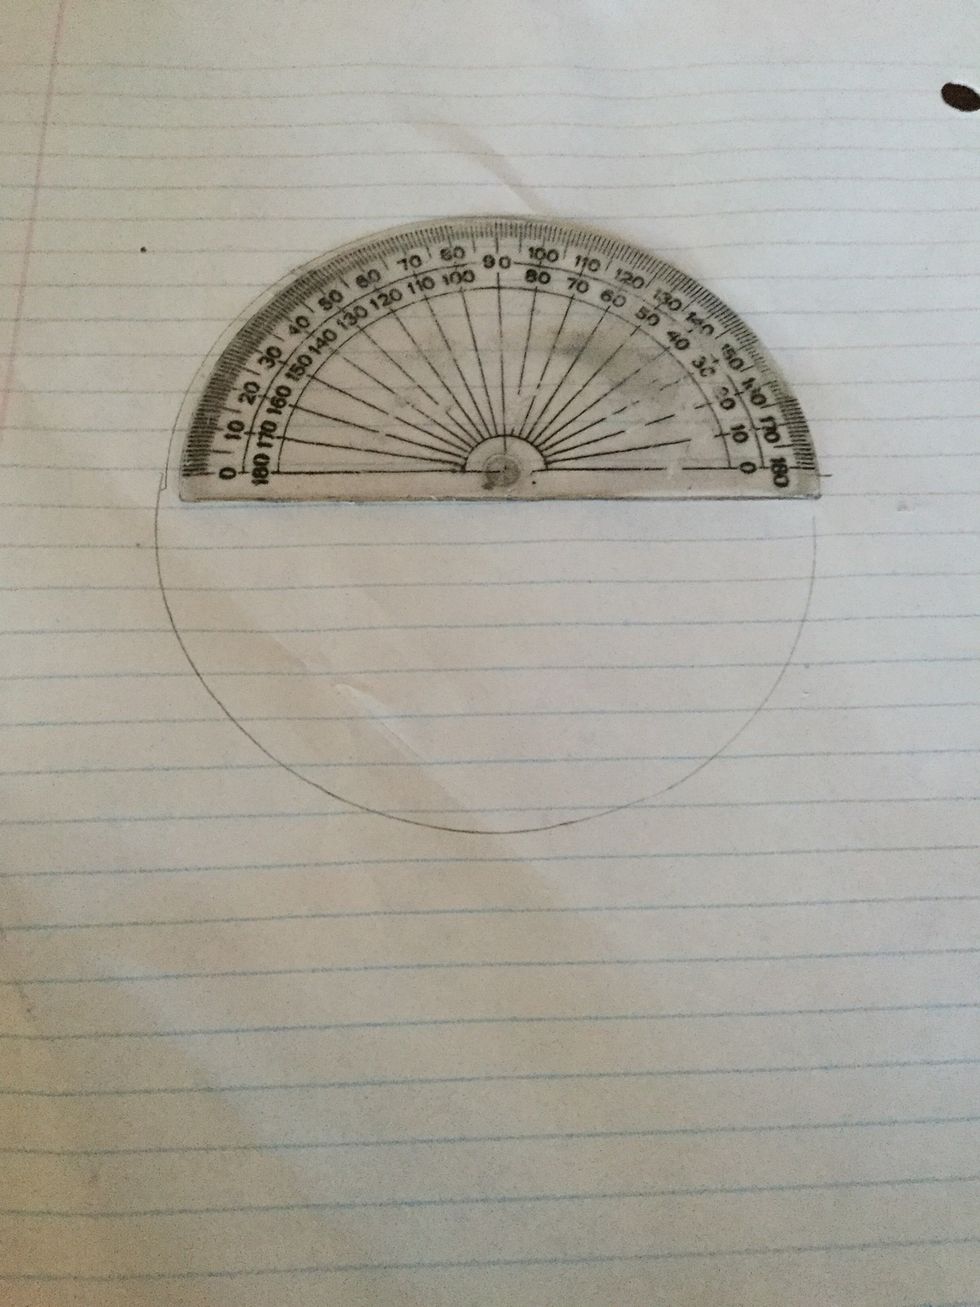
1st line up your protractor with your circle
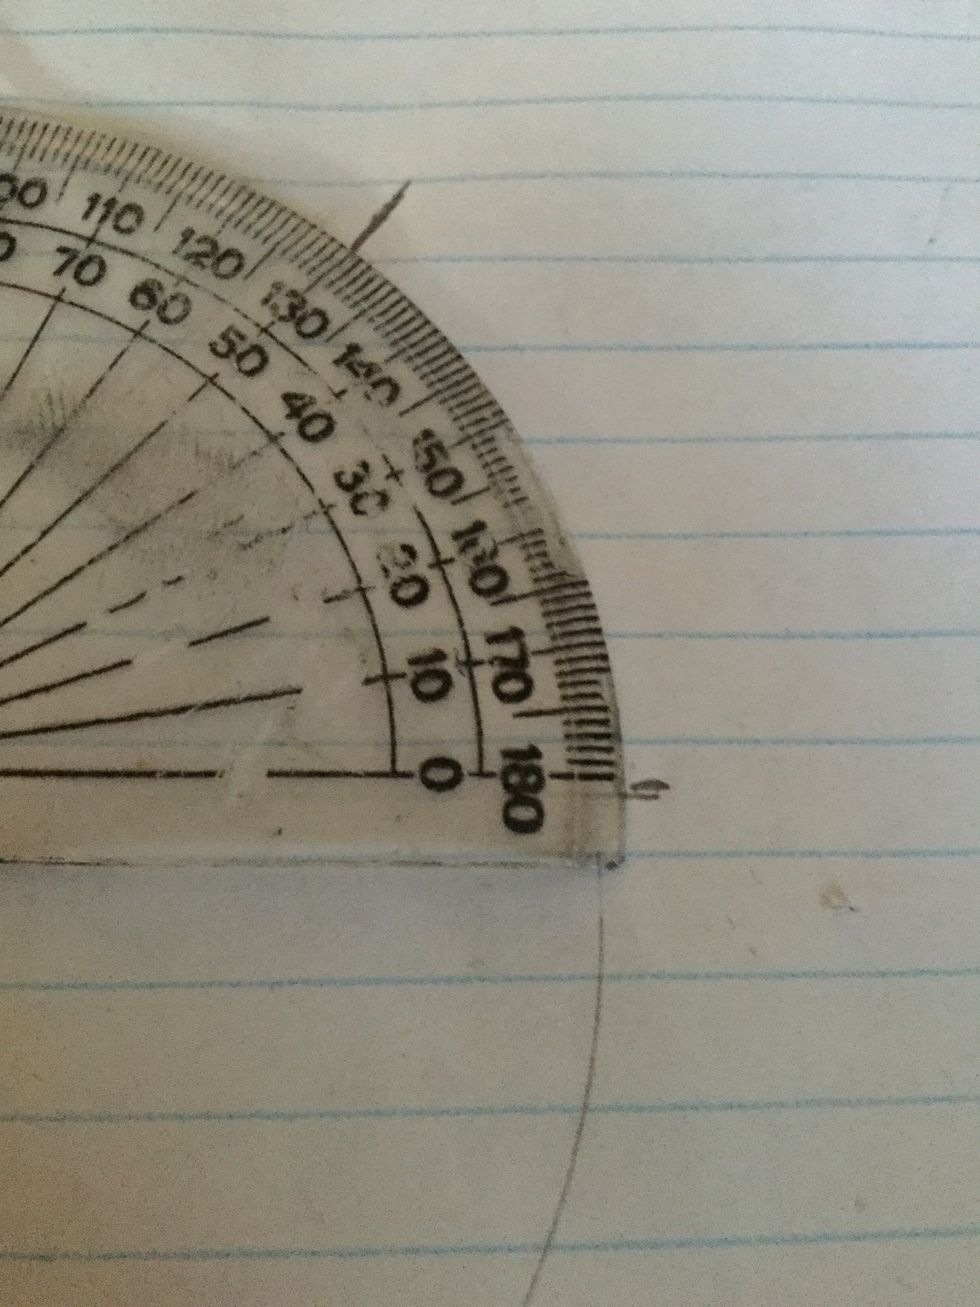
2nd mark the angle that you came up with using the formula provided
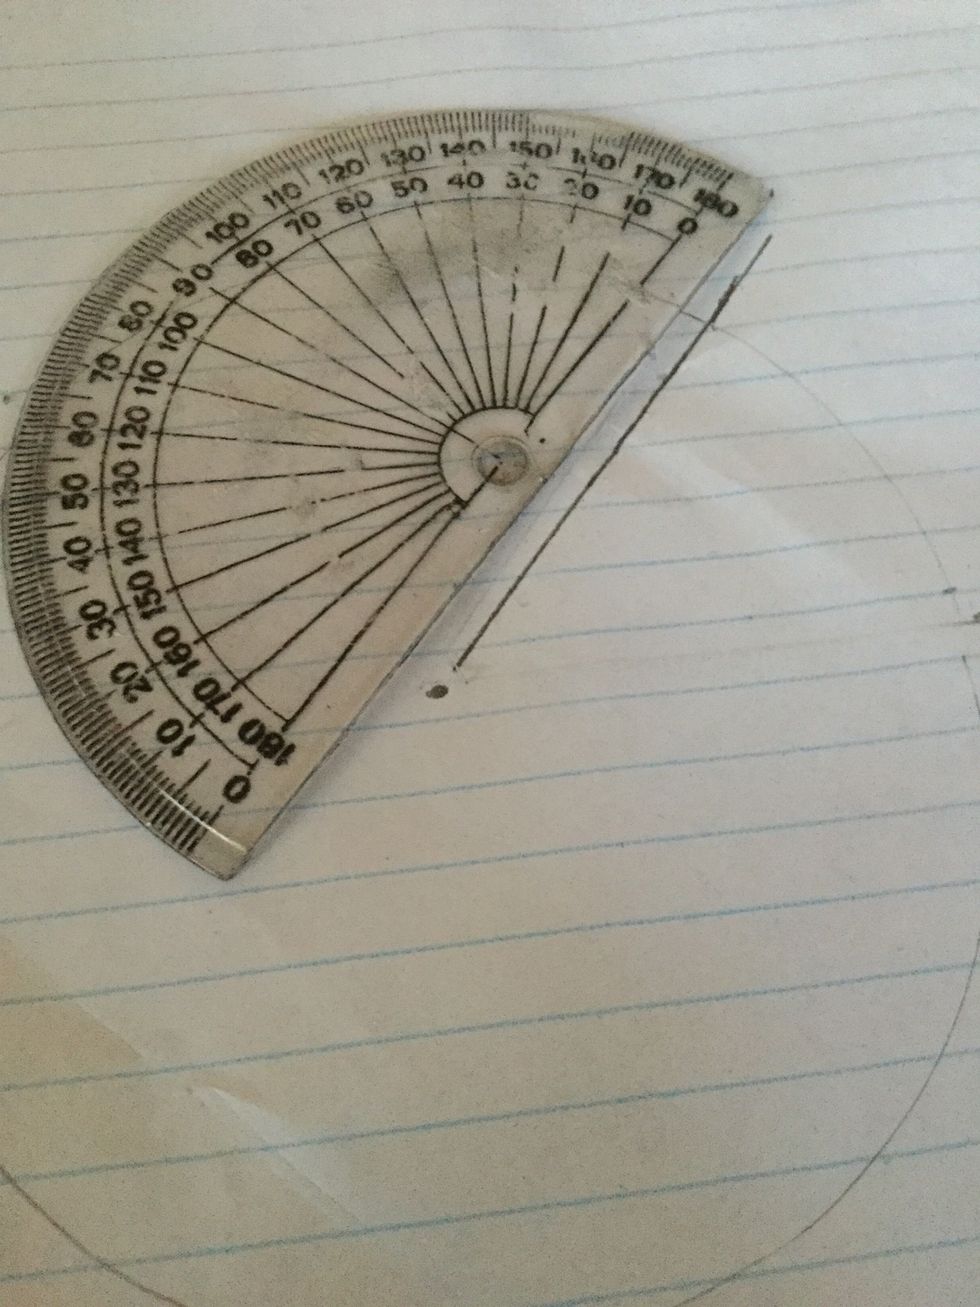
Then using the straight side of your protractor connect the center point with the mark you just drew
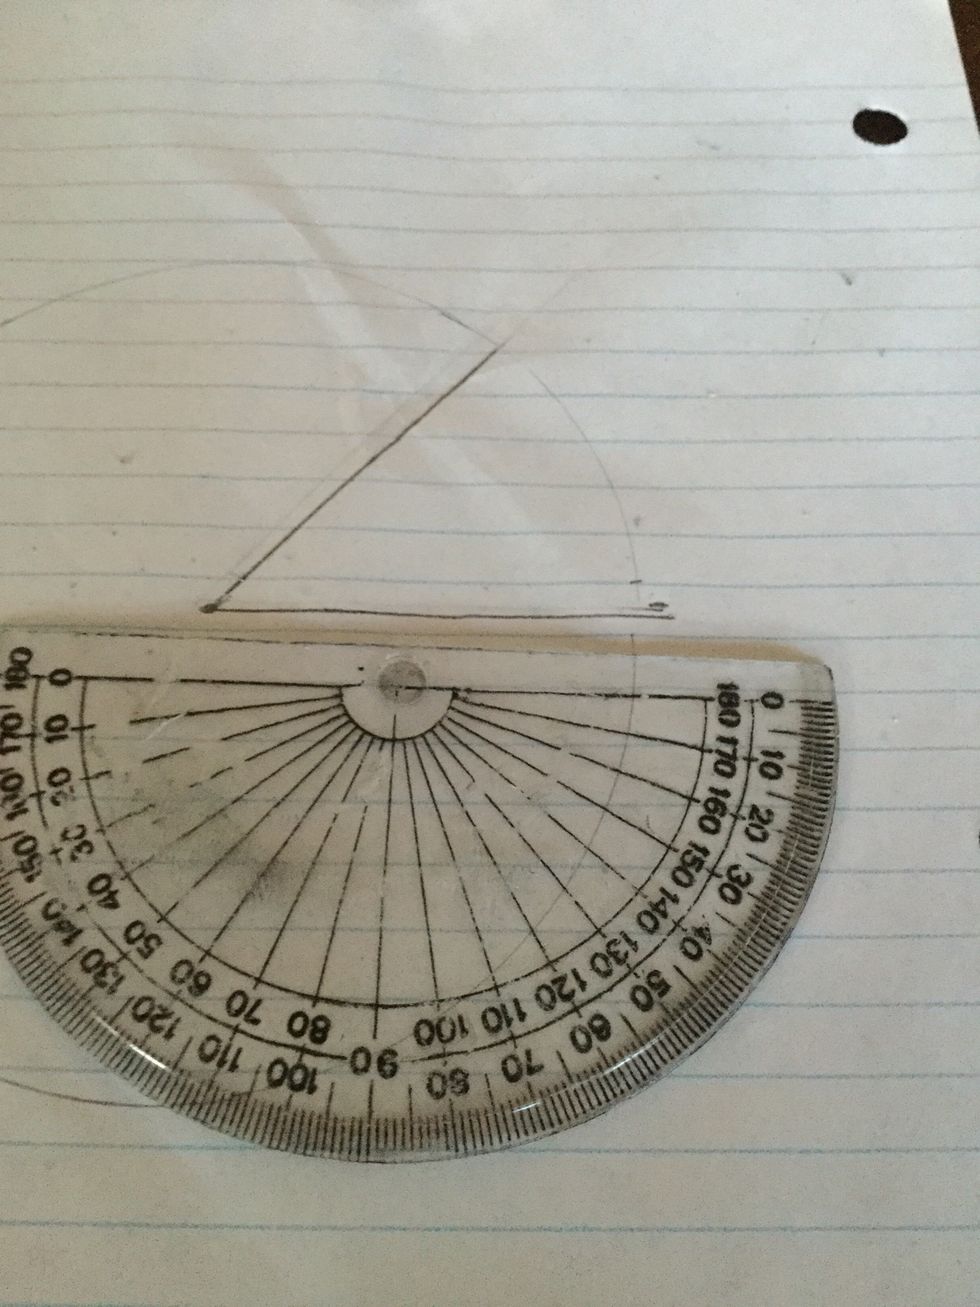
Do the same for the bottom part
Continue to do this until your pie graph is complete
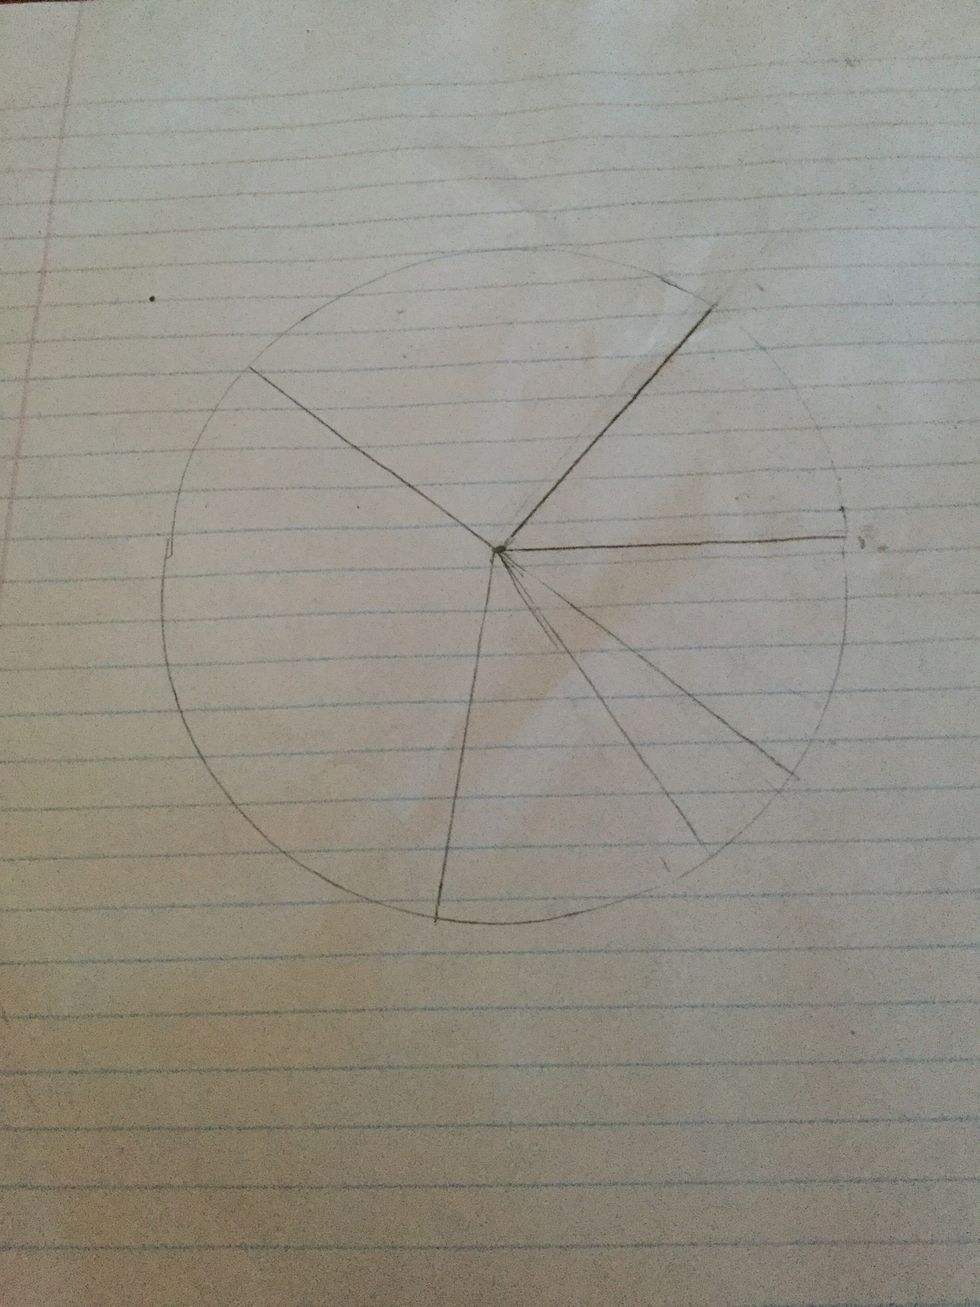
Next label each section of your graph and give it a title

You've just made a pie graph!
Here are a few things you can do to your graph
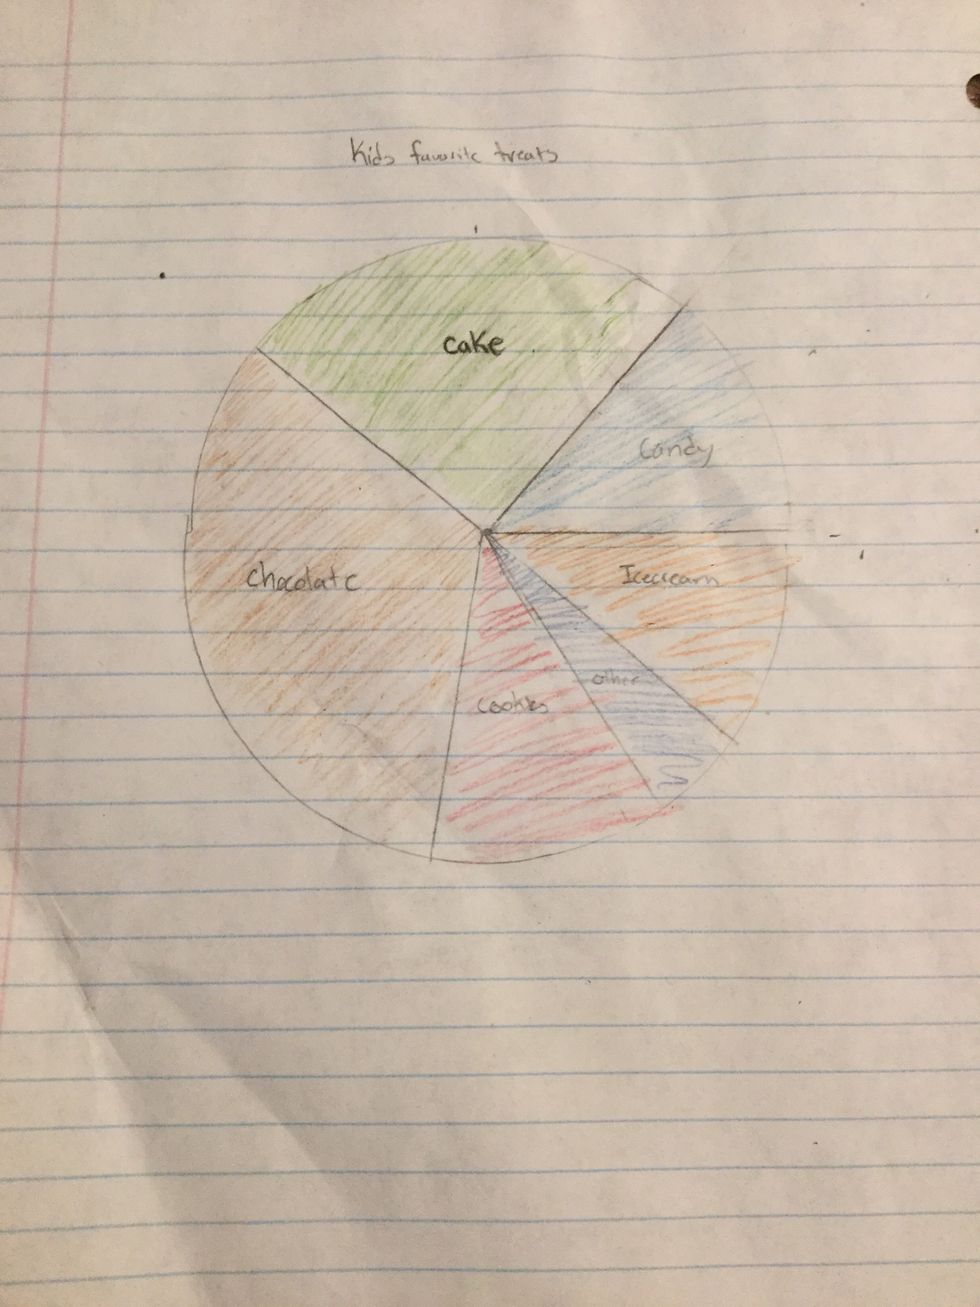
You can color it
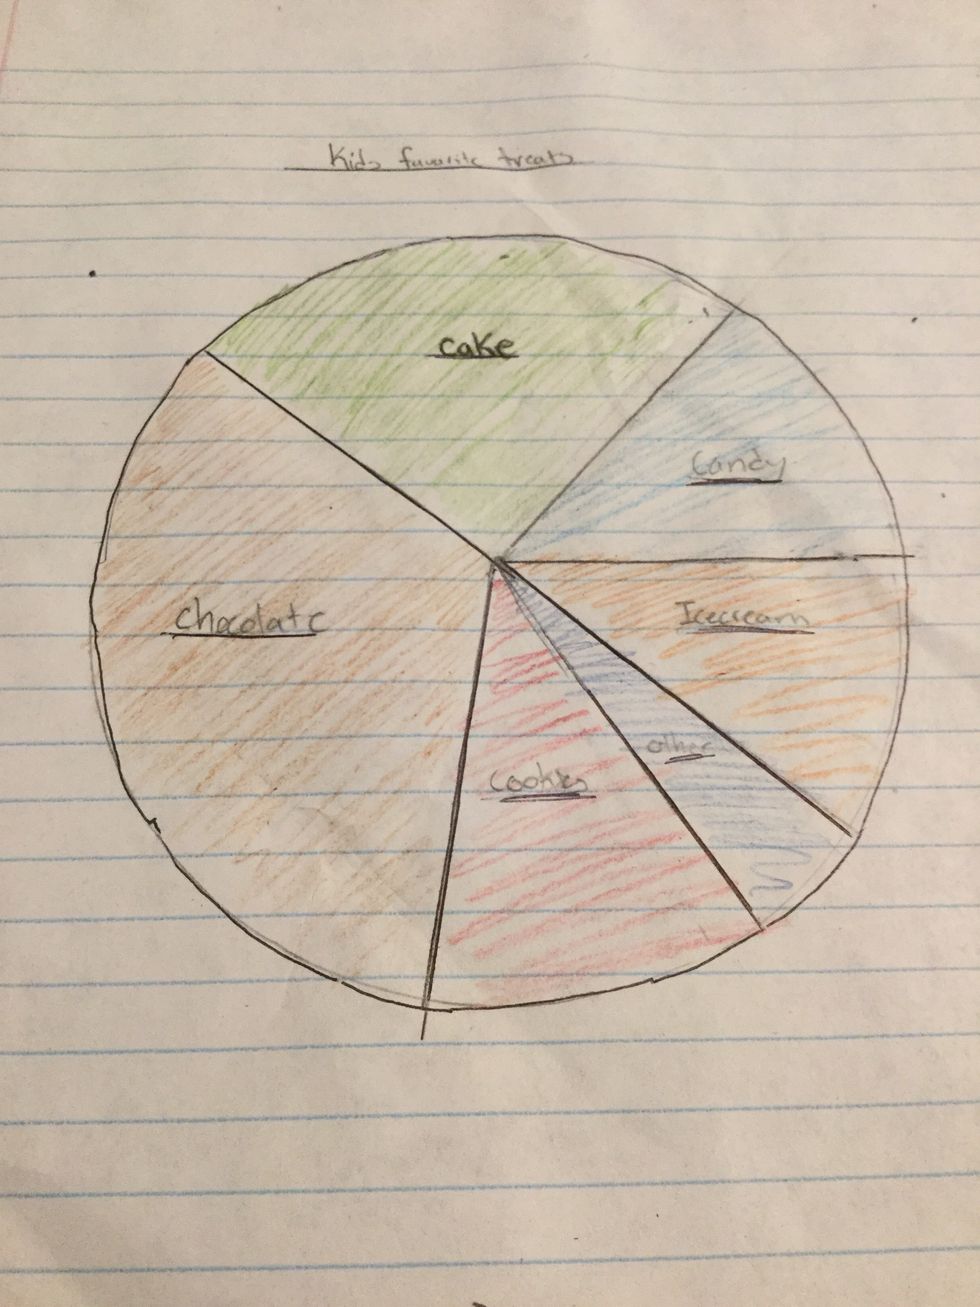
And fine line it
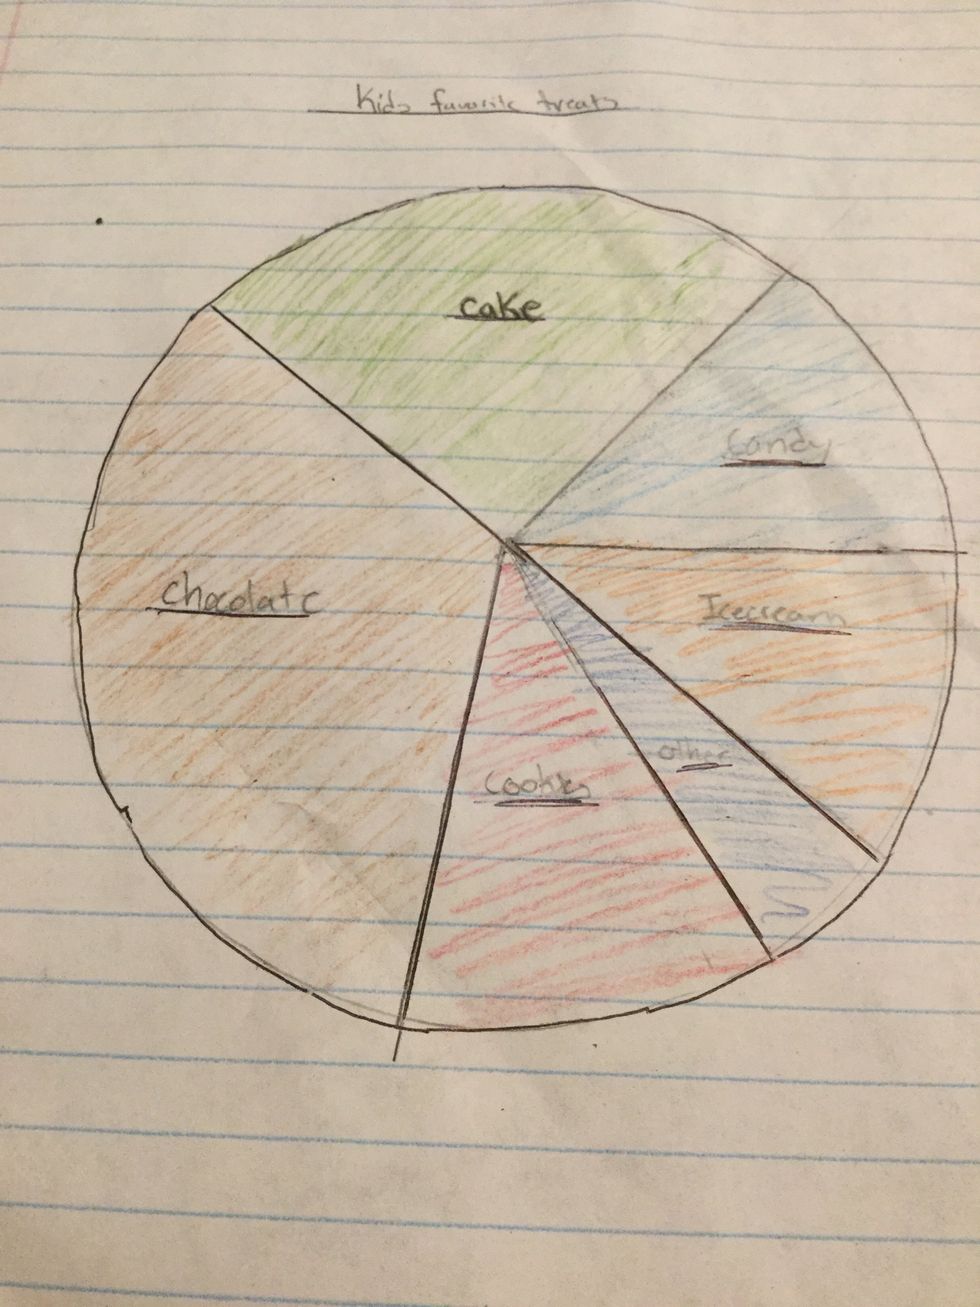
And there you go! You made your very own pie graph
- 1.0 compass
- 1.0 Protractor
- 1.0 Sharp pencil
- 1.0 A sheet of paper
- 6.0 A few coloured pencils ( optional )
- 1.0 And an eraser
The Conversation (0)
Sign Up