The Conversation (0)
Sign Up
Once you have completed a Nearpod presentation, login to your account on a PC or Mac. Click the bar graph icon to access reports.
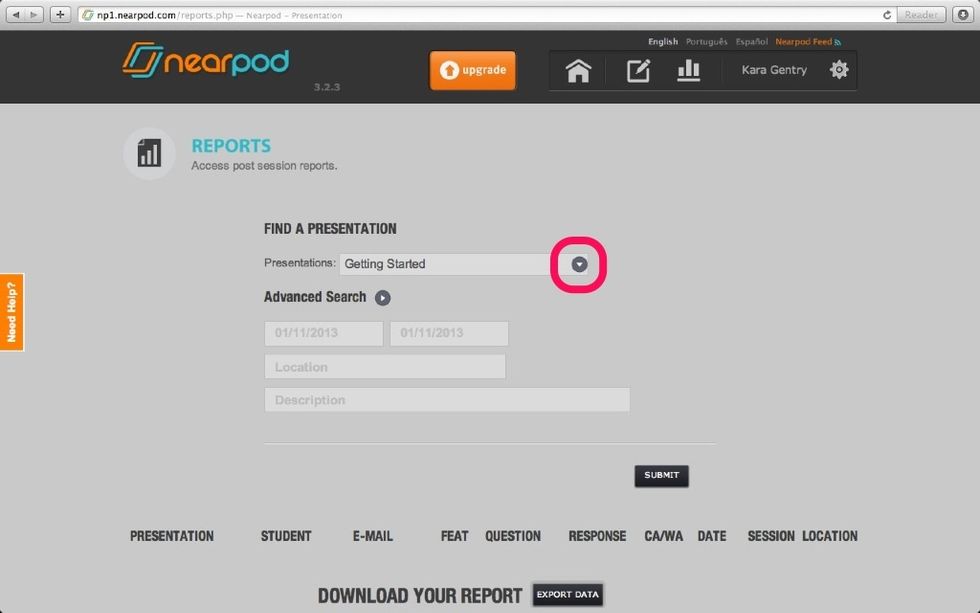
Find the presentation you'd like a report on by using the Presentations drop down.
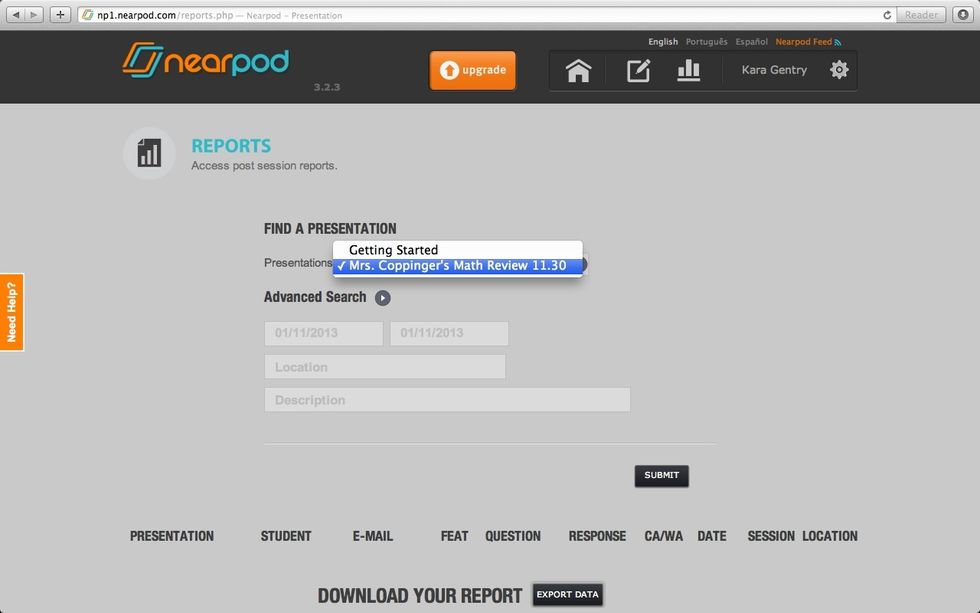
Select the presentation for your report.
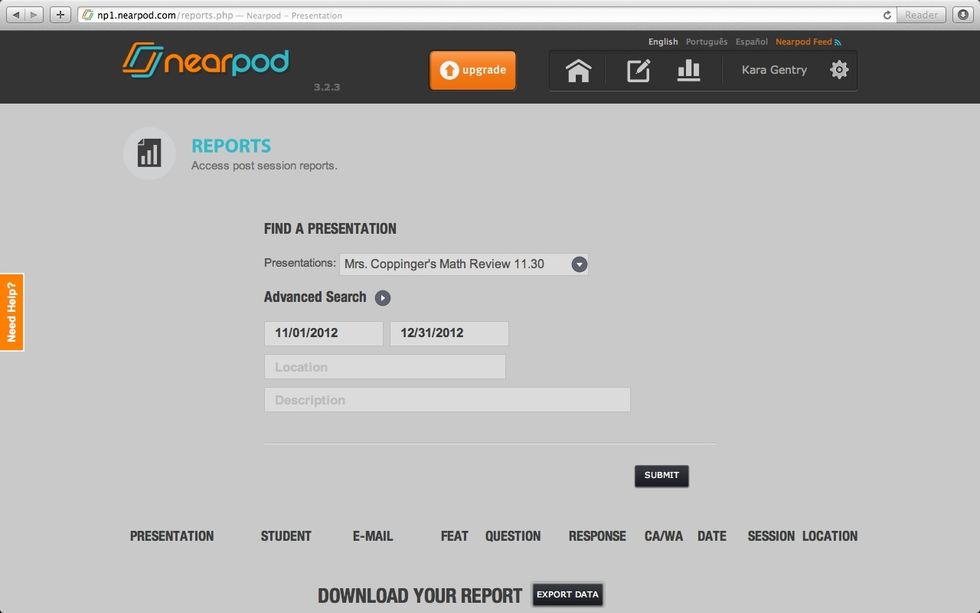
Advanced search options also allow you to narrow presentations by date range.
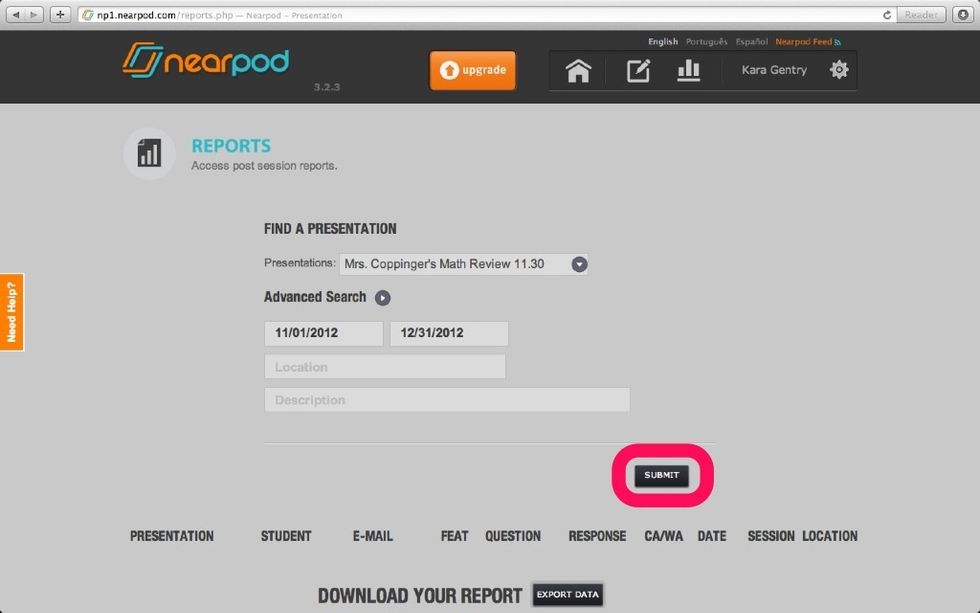
Click the Submit button.
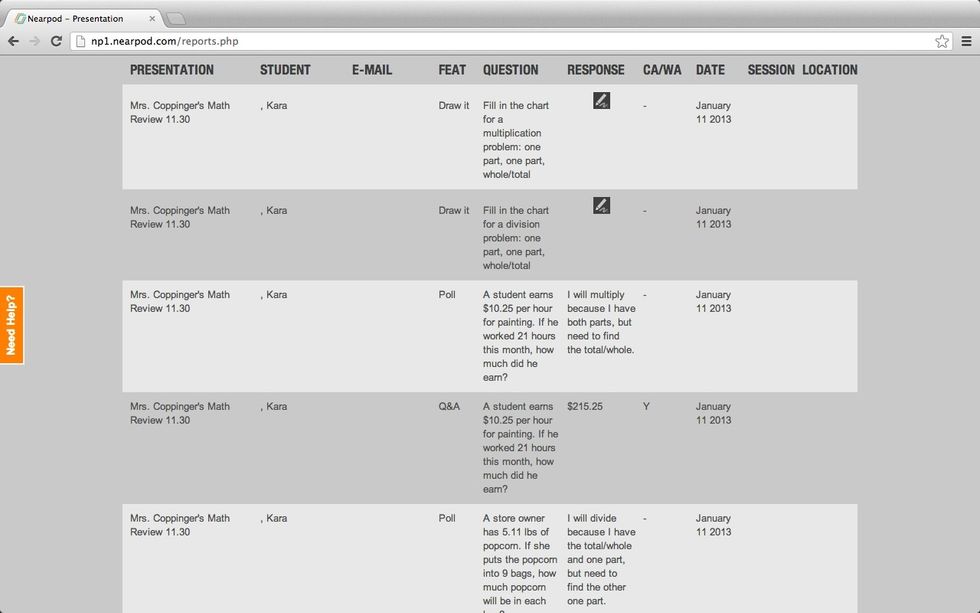
Your report appears below. The CA/WA column shows a "Y" if the student answered correctly and a "N" if incorrect.
Draw it slide responses can be viewed by hovering over the drawing icon.
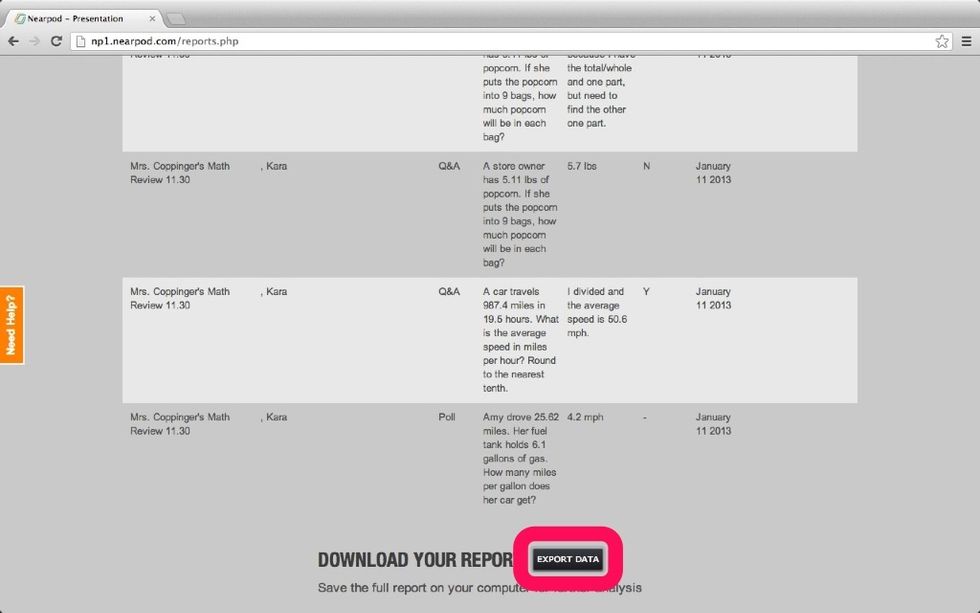
At the bottom of the page you can export the data by downloading the report and saving as an Excel document.
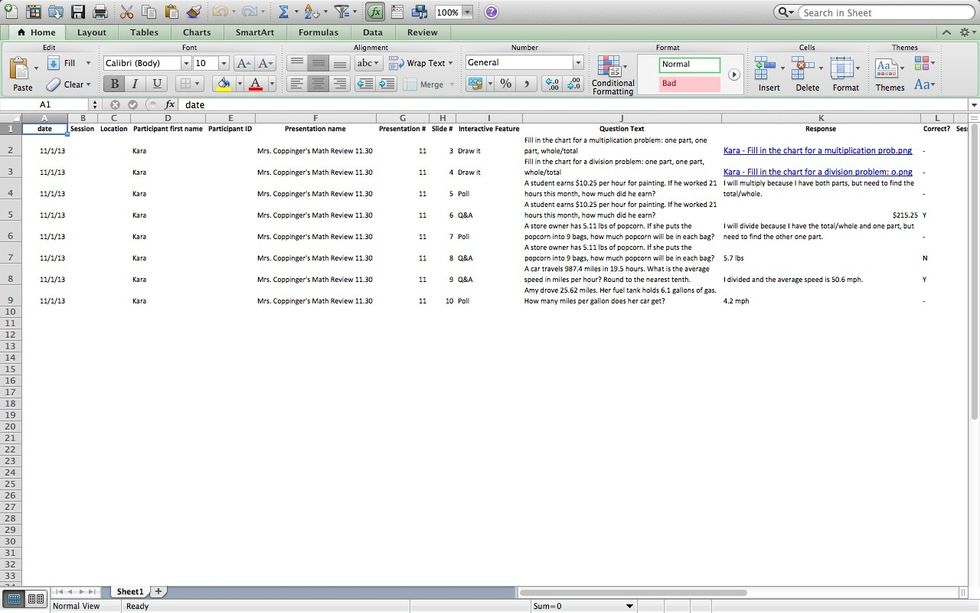
This is an example of what the report looks like when you export to Excel. The blue hyperlinks are the draw it slide responses.

When you click the blue hyperlink, the draw it slide responses open in a new window and display like this.